The CIPA January 2025 stats are now available online:
CIPA January 2025 stats
CIPA also revealed their 2025 camera and lens shipment forecast and price graphs:
Shipment forecast for 2025
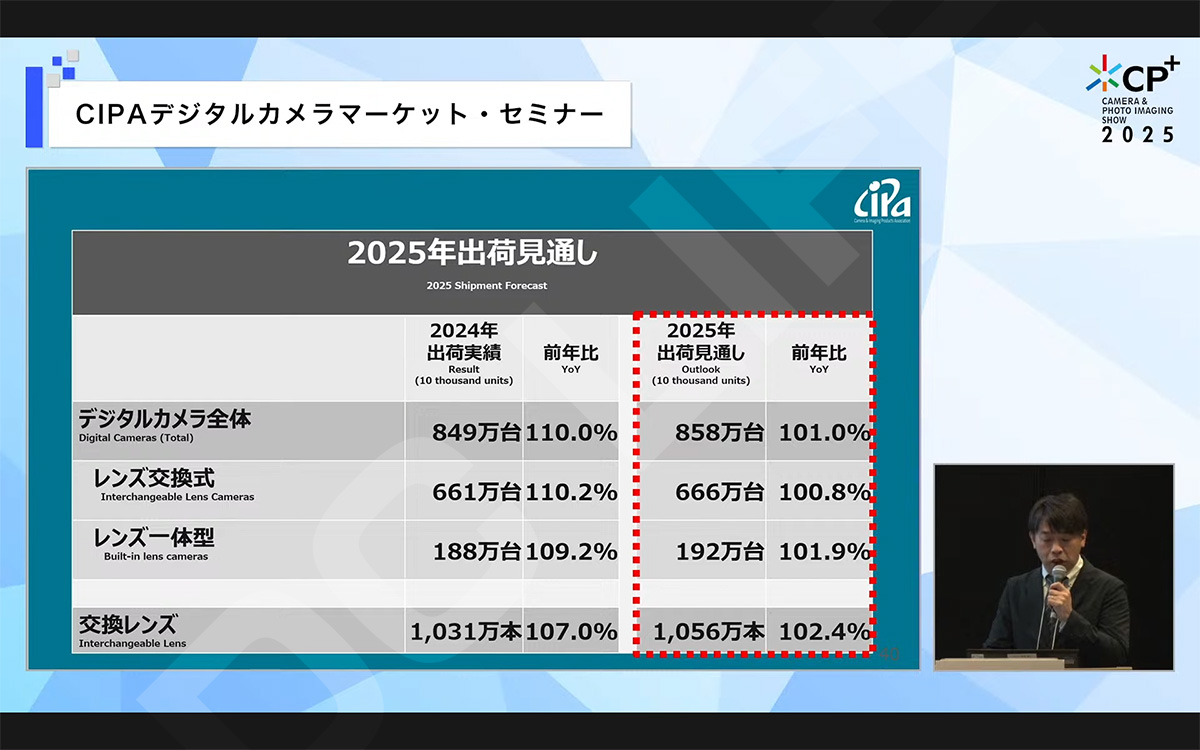
The graph, presented by CIPA (Camera & Imaging Products Association) at the CP+ Camera & Photo Imaging Show 2025, provides the 2025 shipment forecast for digital cameras, comparing the 2024 results (in ten thousand units) with the 2025 outlook, including year-over-year (YoY) percentage changes. The data is categorized into total digital cameras, interchangeable-lens cameras, built-in lens cameras, and interchangeable lens cameras specifically.
2024 Results (in ten thousand units):
- Total Digital Cameras (Total): 84.9 units, with a YoY increase of 110.0%.
- Interchangeable-lens Cameras: 66.1 units, with a YoY increase of 110.2%.
- Built-in lens Cameras: 18.8 units, with a YoY increase of 109.2%.
- Interchangeable Lens Cameras: 1,031 units, with a YoY increase of 107.0%.
2025 Outlook (in ten thousand units):
- Total Digital Cameras (Total): 85.8 units, with a YoY increase of 101.0%.
- Interchangeable-lens Cameras: 66.6 units, with a YoY increase of 100.8%.
- Built-in lens Cameras: 19.2 units, with a YoY increase of 101.9%.
- Interchangeable Lens Cameras: 1,056 units, with a YoY increase of 102.4%.
The forecast indicates a modest growth in shipments for 2025 compared to 2024, with all categories showing a slight slowdown in the rate of increase. Total digital camera shipments are expected to rise from 84.9 to 85.8 units (101.0% YoY), interchangeable-lens cameras from 66.1 to 66.6 units (100.8% YoY), built-in lens cameras from 18.8 to 19.2 units (101.9% YoY), and interchangeable lens cameras specifically from 1,031 to 1,056 units (102.4% YoY).
Shipment volume of Interchangeable lens cameras
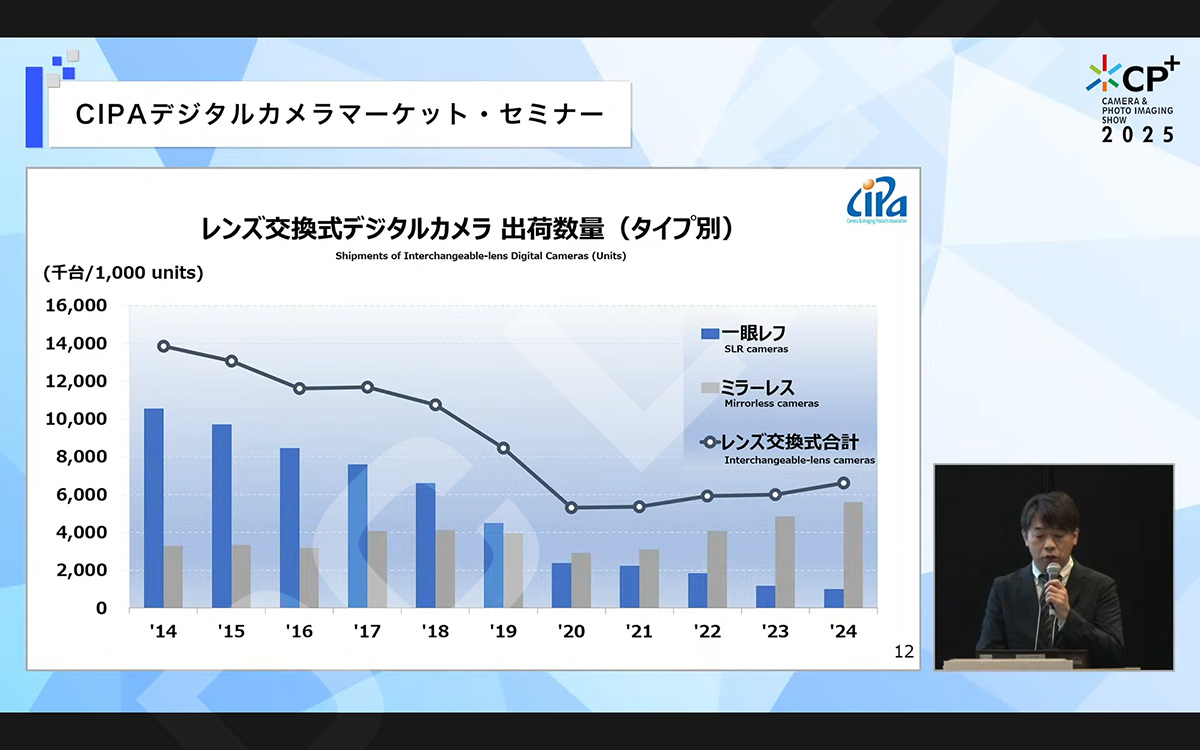
The graph, presented by CIPA (Camera & Imaging Products Association) at the CP+ Camera & Photo Imaging Show 2025, illustrates the shipments of interchangeable-lens digital cameras (in thousands of units) from 2014 to 2024. The data is categorized into two types: SLR cameras (blue bars) and mirrorless cameras (gray bars), with a line graph representing the total shipments of interchangeable-lens cameras.
- 2014: Total shipments started at around 12,000 units, with SLR cameras dominating at approximately 10,000 units and mirrorless cameras contributing around 2,000 units.
- 2015-2017: Total shipments remained relatively stable, fluctuating between 10,000 and 12,000 units. SLR camera shipments stayed high, around 8,000-10,000 units, while mirrorless camera shipments began to grow, reaching about 4,000 units by 2017.
- 2018-2020: A noticeable decline in total shipments occurred, dropping to around 6,000 units by 2020. SLR camera shipments decreased significantly to around 2,000-4,000 units, while mirrorless camera shipments started to rise, contributing a larger share.
- 2021-2024: Total shipments showed a slight recovery, stabilizing around 6,000-8,000 units by 2024. Mirrorless camera shipments increased to approximately 4,000-6,000 units, overtaking SLR cameras, which dropped to minimal levels (around 1,000-2,000 units).
The graph indicates a shift from SLR to mirrorless cameras in the interchangeable-lens camera market, with total shipments peaking in the mid-2010s and then declining, followed by a modest recovery driven by mirrorless technology.
Interchangeable lens digital camera shipment value 2014-2024
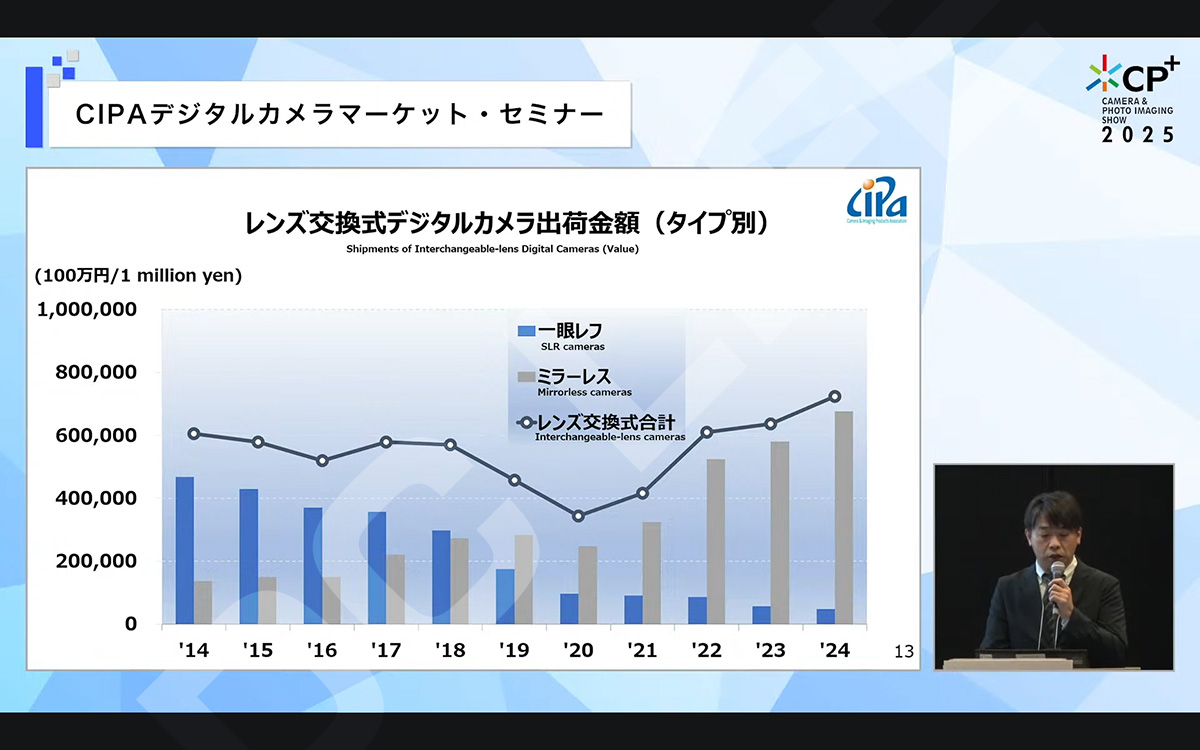
The graph, presented by CIPA (Camera & Imaging Products Association) at the CP+ Camera & Photo Imaging Show 2025, illustrates the shipments of interchangeable-lens digital cameras in terms of value (in 100 million yen) from 2014 to 2024. The data is divided into two categories: SLR cameras (blue bars) and mirrorless cameras (gray bars), with a line graph representing the total value of interchangeable-lens cameras.
-
2014: The value started at approximately 400,000 (100 million yen), with SLR cameras dominating.
-
2015-2017: The value remained relatively stable, fluctuating around 400,000-500,000, with a gradual decline in SLR camera shipments and a slight increase in mirrorless camera shipments.
-
2018-2019: There was a noticeable drop in total value, reaching a low of around 200,000-300,000, with mirrorless cameras beginning to gain more market share.
-
2020-2021: The value continued to decline, hitting its lowest point around 200,000, with mirrorless cameras overtaking SLR cameras in contribution.
-
2022-2024: A significant recovery is observed, with the total value rising sharply to over 800,000 by 2024, driven largely by a surge in mirrorless camera shipments, while SLR camera shipments remain minimal.
Overall, the graph highlights a shift from SLR to mirrorless cameras and a strong recovery in the market value of interchangeable-lens cameras in recent years.
Average shipping cost of digital cameras 2012-2024
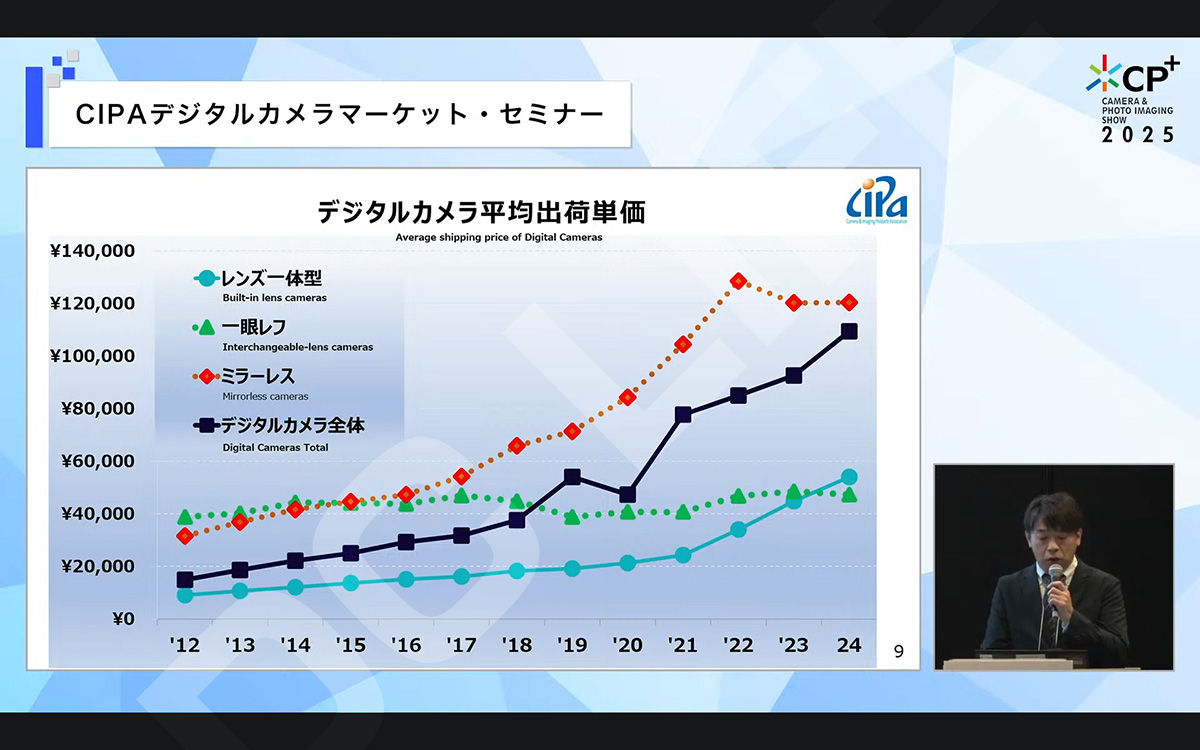
The graph, presented by CIPA (Camera & Imaging Products Association) at the CP+ Camera & Photo Imaging Show 2025, displays the average shipping price of digital cameras in yen from 2012 to 2024. The data is categorized into four types: built-in lens cameras, interchangeable-lens cameras, mirrorless cameras, and the overall average price of digital cameras.
- 2012-2014: The average price for all digital cameras (black line) started around ¥40,000 and remained relatively stable, with built-in lens cameras (cyan line) around ¥20,000-¥30,000, interchangeable-lens cameras (green line) around ¥40,000-¥50,000, and mirrorless cameras (red dashed line) beginning to rise from around ¥60,000.
- 2015-2019: The overall average price saw a slight decline to around ¥30,000-¥40,000. Built-in lens cameras remained steady at ¥20,000-¥30,000, while interchangeable-lens cameras fluctuated around ¥40,000-¥50,000. Mirrorless cameras showed a steady increase, reaching approximately ¥80,000 by 2019.
- 2020-2021: The overall average price dipped to its lowest point around ¥30,000. Built-in lens cameras stayed low at ¥20,000-¥30,000, interchangeable-lens cameras dropped to around ¥40,000, and mirrorless cameras peaked at around ¥100,000 before a slight decline.
- 2022-2024: A significant upward trend emerged, with the overall average price rising to over ¥60,000 by 2024. Built-in lens cameras increased to around ¥40,000, interchangeable-lens cameras rose to approximately ¥60,000, and mirrorless cameras surged to over ¥120,000, driving the overall increase.
The graph indicates a general increase in the average shipping price of digital cameras, particularly driven by the rising cost of mirrorless cameras in recent years.
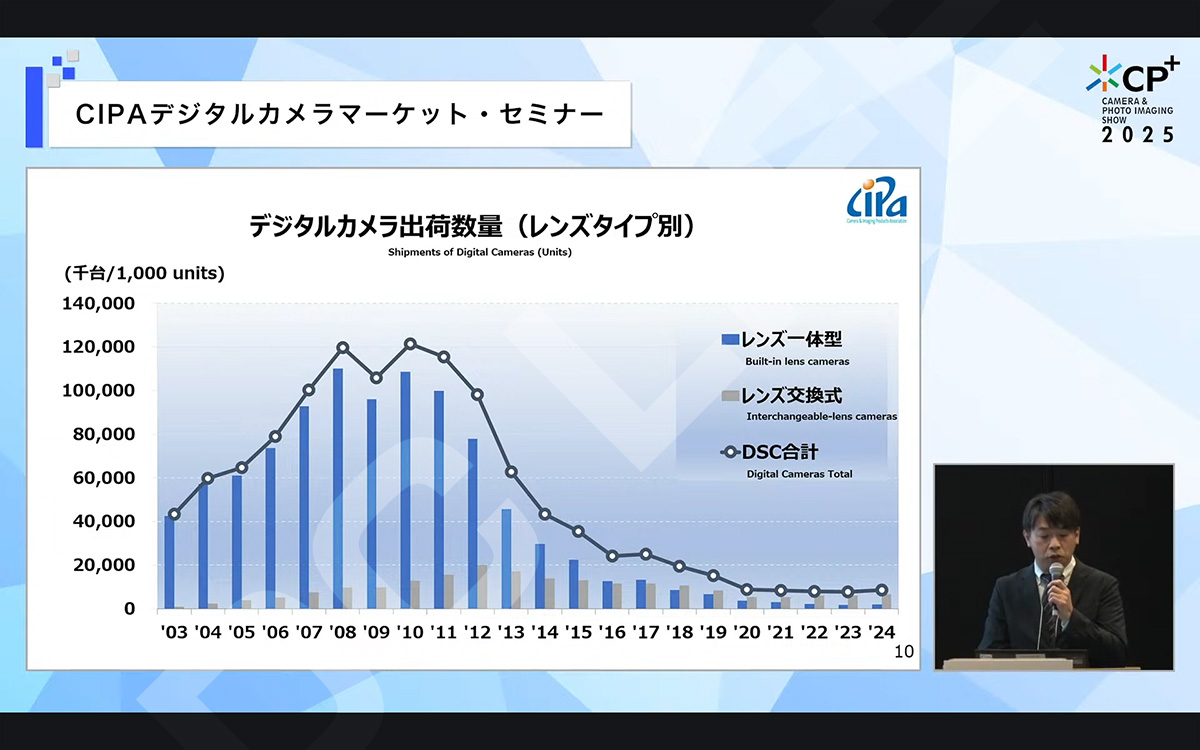
Digital camera shipment volumes from 2003 to 2002
The graph, presented by CIPA (Camera & Imaging Products Association) at the CP+ Camera & Photo Imaging Show 2025, shows the shipments of digital cameras (in thousands of units) from 2003 to 2024. The data is categorized into three groups: built-in lens cameras, interchangeable-lens cameras, and the total digital camera shipments.
- 2003-2007: Total digital camera shipments (black dotted line) began at around 40,000 units and rose sharply to a peak of approximately 120,000 units by 2007. Built-in lens cameras (blue bars) dominated, contributing the majority of the shipments, while interchangeable-lens cameras (gray bars) started at a low level and remained minimal.
- 2008-2010: The total shipments reached their highest point, exceeding 140,000 units, driven primarily by built-in lens cameras. Interchangeable-lens camera shipments began to increase slightly but remained a small fraction.
- 2011-2019: A significant decline occurred, with total shipments dropping to around 20,000-30,000 units by 2019. Built-in lens camera shipments fell sharply, while interchangeable-lens camera shipments saw a temporary rise around 2012-2014 before declining.
- 2020-2024: The total shipments continued to decline steadily, stabilizing at around 10,000 units by 2024. Built-in lens camera shipments became negligible, and interchangeable-lens camera shipments also dropped to low levels.
The graph highlights a dramatic peak in digital camera shipments in the mid-2000s, followed by a consistent decline over the subsequent years, with built-in lens cameras initially driving the market and interchangeable-lens cameras failing to sustain growth.
Here are also the latest data from BCNR:
Shipment Trends (2018–2024):
- 2018: Shipments stood at 2.846 million units.
- 2019: A significant decline to 2.316 million units.
- 2020: Further drop to 1.296 million units, influenced by the COVID-19 pandemic.
- 2023: Reaching a low of 912,000 units.
- 2024: A slight recovery to 1.012 million units.
Breakdown by Camera Type:
- 2018–2021: Compact cameras with integrated lenses accounted for about 60% of shipments, DSLRs 10%, and mirrorless cameras just over 20%.
- 2022: Mirrorless camera shipments surged, surpassing compact cameras.
- 2024: Mirrorless cameras constituted 53.6% of total shipments.
Sales Data from BCN Ranking:
- Despite the increase in mirrorless camera shipments, actual sales data indicates that compact cameras with integrated lenses continue to dominate, maintaining over 60% of sales from 2018 to 2024.
- Mirrorless cameras, while growing from 18.4% in 2018 to 32.3% in 2024, have not exceeded a 30% sales share.
Sources:
Screenshots via dclife
The post CIPA reveals 2025 camera and lens shipment forecast and price graphs appeared first on Photo Rumors.